Whether to Cycle
Summary
Application of machine learning to predict bike share usage in Washington D.C.. Design and implementation of data pipeline, tested across multiple regression and decision models with performance output. Submitted to a Kaggle competition.
Introduction
This project uses machine learning techniques to predict hourly bike rental demand in the Capital Bikeshare program in Washington, D.C.. The learning algorithms combine historical usage patterns with weather data such as temperature, humidity, windspeed and weather conditions.
Using bike sharing systems, people rent a bike from a one location and return it to a different place on an as-needed basis. The process of obtaining membership, rental, and bike return is automated and tracked via a network of kiosks around the city. The duration of travel, departure location, arrival location, and time elapsed is recorded. The data consists of hourly rental data spanning two years. The training set is comprised of the first 19 days of each month, while the test set is the 20th to the end of the month.

EDA and Pipeline
The data consists of hourly rental data spanning two years. The training set is comprised of the first 19 days of each month, while the test set is the 20th to the end of the month. The features include:
- a datetime stamp for bike sharing event
- numeric values to categorize holidays, work days, seasons (1-4) and weather conditions (1-4)
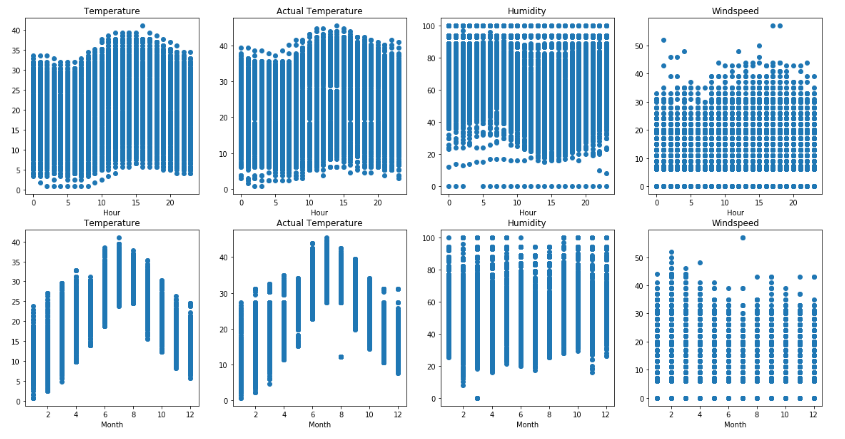
- numeric values to quantify the temperature, actual temperature, humidity and windspeed. These quantity values are fairly normally distributed with different means.
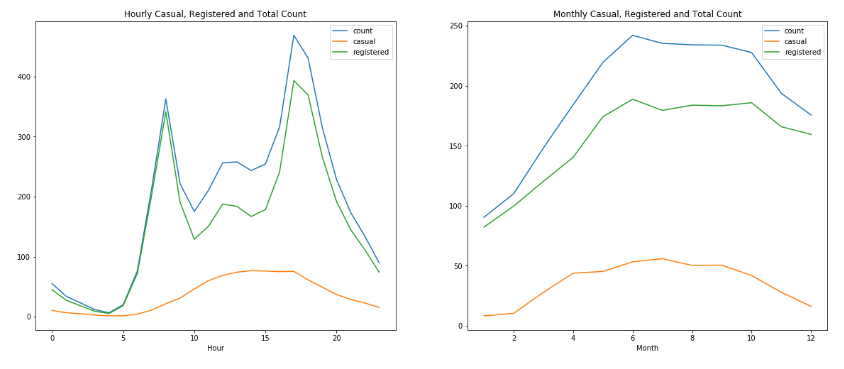
The predictors include a total hourly count of bike sharing events, also split into two separate counts for registered and casual users.
For processing purposes, the features were transformed as such:
- Datetime feature creation - transformed the timestamp into individual variables for hour, day, month and year
- Categorical datatype - the data set included 4 integer variables which were converted into categorical data type: Season, holiday, workingday, weather
- Numeric scaling - the measurement values for temperature, humidity and windspeed were scaled to normalized z-scores
Additionally, the training set was split to include a dev set. Models were tested using casual and registered output variables as well as the total count in the training and dev sets.
Models
Linear Regression and Regularization
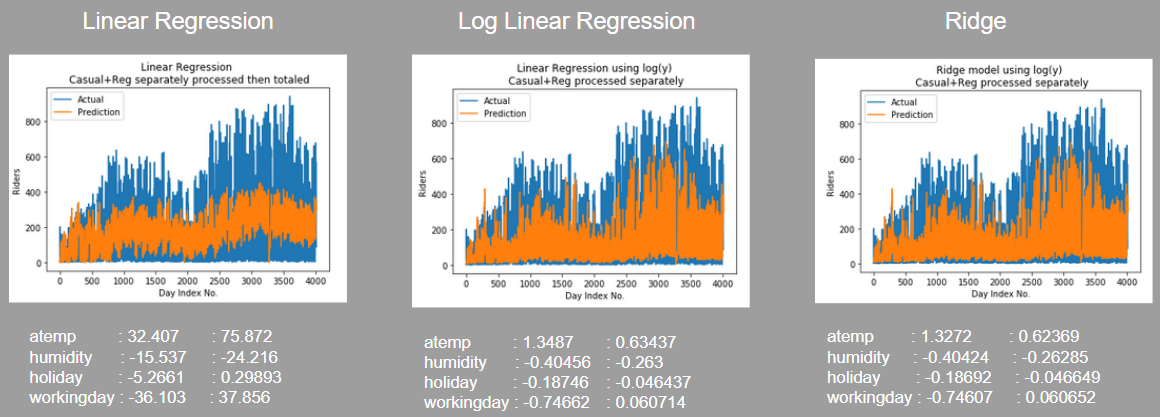
A number of models were tested using both versions of the output variables and various levels of regularization. The output variables were further transformed to use the log(y) of the rental events. The output transformation improved overall performance, but regularization over the log(y) linear regression model didn’t effectively reduce the complexity of the model, as penalizing the size of the coefficients is less effective when the coefficients are already small from using the log(y) transform. In each case the regularization strength selected by cross validation was small.

Classification Models
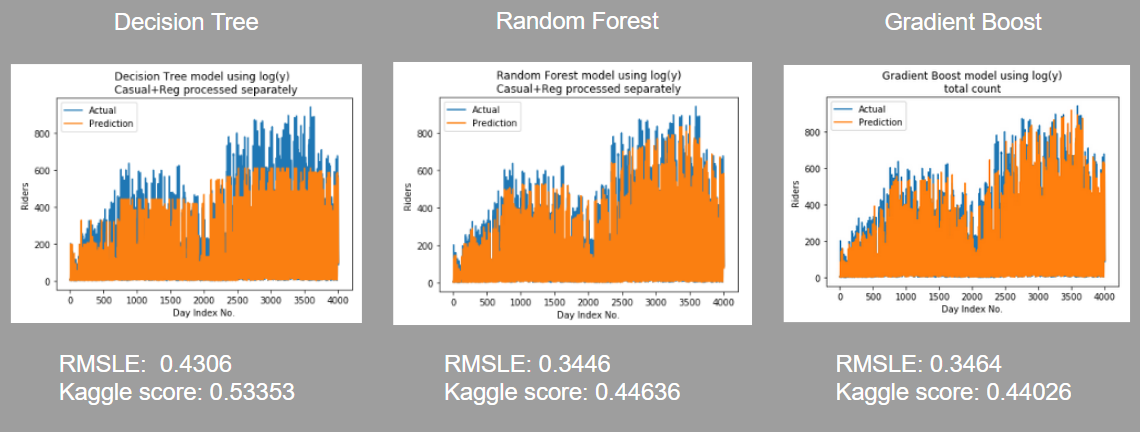
Classification models combine regression and classification, building a model by learning simple decision rules. For this project, the simplest classification model, Decision Tree, performed better than linear regression due to some binned categorical features (weekday y/n). It may have benefited from further bins. i.e. rain, yes/no, temp above a certain marker, etc.., but regardless it returns a class, primarily. This class may have been “good day (weather) vs bad day” or “good day (weekend) vs bad day”. This is when the casual/registered split becomes more powerful, as it enables the DT to focus on the weather and the day of the week as separate categories, whereas in the count metric they send mixed signals, and weekdays/rush hour may have as much total traffic as weekends. Furthermore the regressor can better evaluate conditions that make the casual user less likely to participate, while the registered user remains unaffected. Separating casual/registered already chooses an attribute, which benefitted the simple model but actually hurt performance of more complex models.
The overall performance improved from Decision Tree to Random Forest to Gradient Boost regression. Predictably, the ensemble method based on the performance of multiple trees worked better than a single tree. The gradient boost iterative gradient descent approach was more effective than the random forest averaging.

Classification Model Explanations
Decision trees build a model by learning simple decision rules. The regressor works similarly to the classifier using numeric values. If a tree becomes overly complex there is a risk of overfitting. The max_depth controls the maximum depth of the tree and min_samples_split controls the minimum number of samples required to split an internal node. Cross validation experiments were performed to obtain parameter values which balance the complexity of the tree against overfitting.
A random forest fits a number of decision trees on sub-samples of the dataset and uses averaging to improve predictive accuracy and control over-fitting. For this test set, the weather tends to be a stronger factor than the actual date, so overfitting to just weather features would lose the flexibility of seasonal data. This forest used 100 trees (estimators)- though more could be added for larger computing environments. The model could use the full number of features in each subset, as recommended for regression problems. Again, cross validation experiments were performed to obtain parameter values and prevent overfitting.
Gradient boosted training function builds up stage wise using the decision tree model, but refines it by combining multiple weak decision trees and an optimised residual function. This way it minimizes the residual error across multiple decision trees, but still uses them as a baseline model. The optimization of the residual may be more effective for classification problems instead of regression, however it still strengthens the decision tree algorithm overall. The model was tested using the same number of estimators for consistency and performance evaluation, with the same methods to prevent overfitting.
Conclusion
Each model was tested internally using the dev set before submitting to the Kaggle competition. Interestingly, the internal RMSLE values showed that the models with the casual/reg split performed better, however this was not reflected by the Kaggle score. This may indicate overfitting, as in some registered users behave more as casual riders, and vice versa. The Gradient Boost total count model received best Kaggle score, landing in the top 25% of entries.
Further Work: Potential features and transformations
Other models could potentially benefit from the “duration of ride” variable, which was not included in this dataset but is captured by the kiosks. It may be a helpful indicator as riders may take into account the length of the trip and weather conditions when deciding whether to use a bike. If there are hourly trends in duration or differences between casual/registered durations this could help with prediction.
Of the provided features, further investigation of absolute temperature versus altered-temperature, impact of dates against seasons, and transformations of the hourly variable (i.e. distance from rush hour) may have benefitted each of the models.
Additionally, there could be more control within the classification models by assigning a “good day” bin either manually or using KNN. However, this was likely wrapped in to the decision tree classifications already and would increase the cost of implementation.
